Determine the optimal clustering strategy
# Load MAAS results
maas.res <- readRDS("../7.MAAS_running/maas.res.all.rds")
barcode.list <- readRDS("../7.MAAS_running/share.barcode.rds")
set.seed(1)
Determine the reasonable clustering strategy
clusPerformance <- data.frame(matrix(nrow = length(maas.test)-1, ncol = 5),
row.names = paste0("dims=", 2:length(maas.test)))
colnames(clusPerformance) <- paste0("k=", 2:6)
for(i in 1:(length(maas.test)-1)){
for(j in 2:6){
df <- as.data.frame(maas.test[[i]]$W)
maas.tmp.clu <- withr::with_seed(2, kmeans(df, centers = j)$cluster)
clusPerformance[i,j-1] <- clusteringMetric(maas.test[[i]]$W, clu = maas.tmp.clu, disMethod = "cosine")
}
}
# Re-running clustering with the optimal performance
df <- as.data.frame(maas.test[[1]]$W)
maas.clu <- data.frame(Cluster = withr::with_seed(2, kmeans(df, centers = 2)$cluster))
maas.clu$Cluster <- as.factor(maas.clu$Cluster)
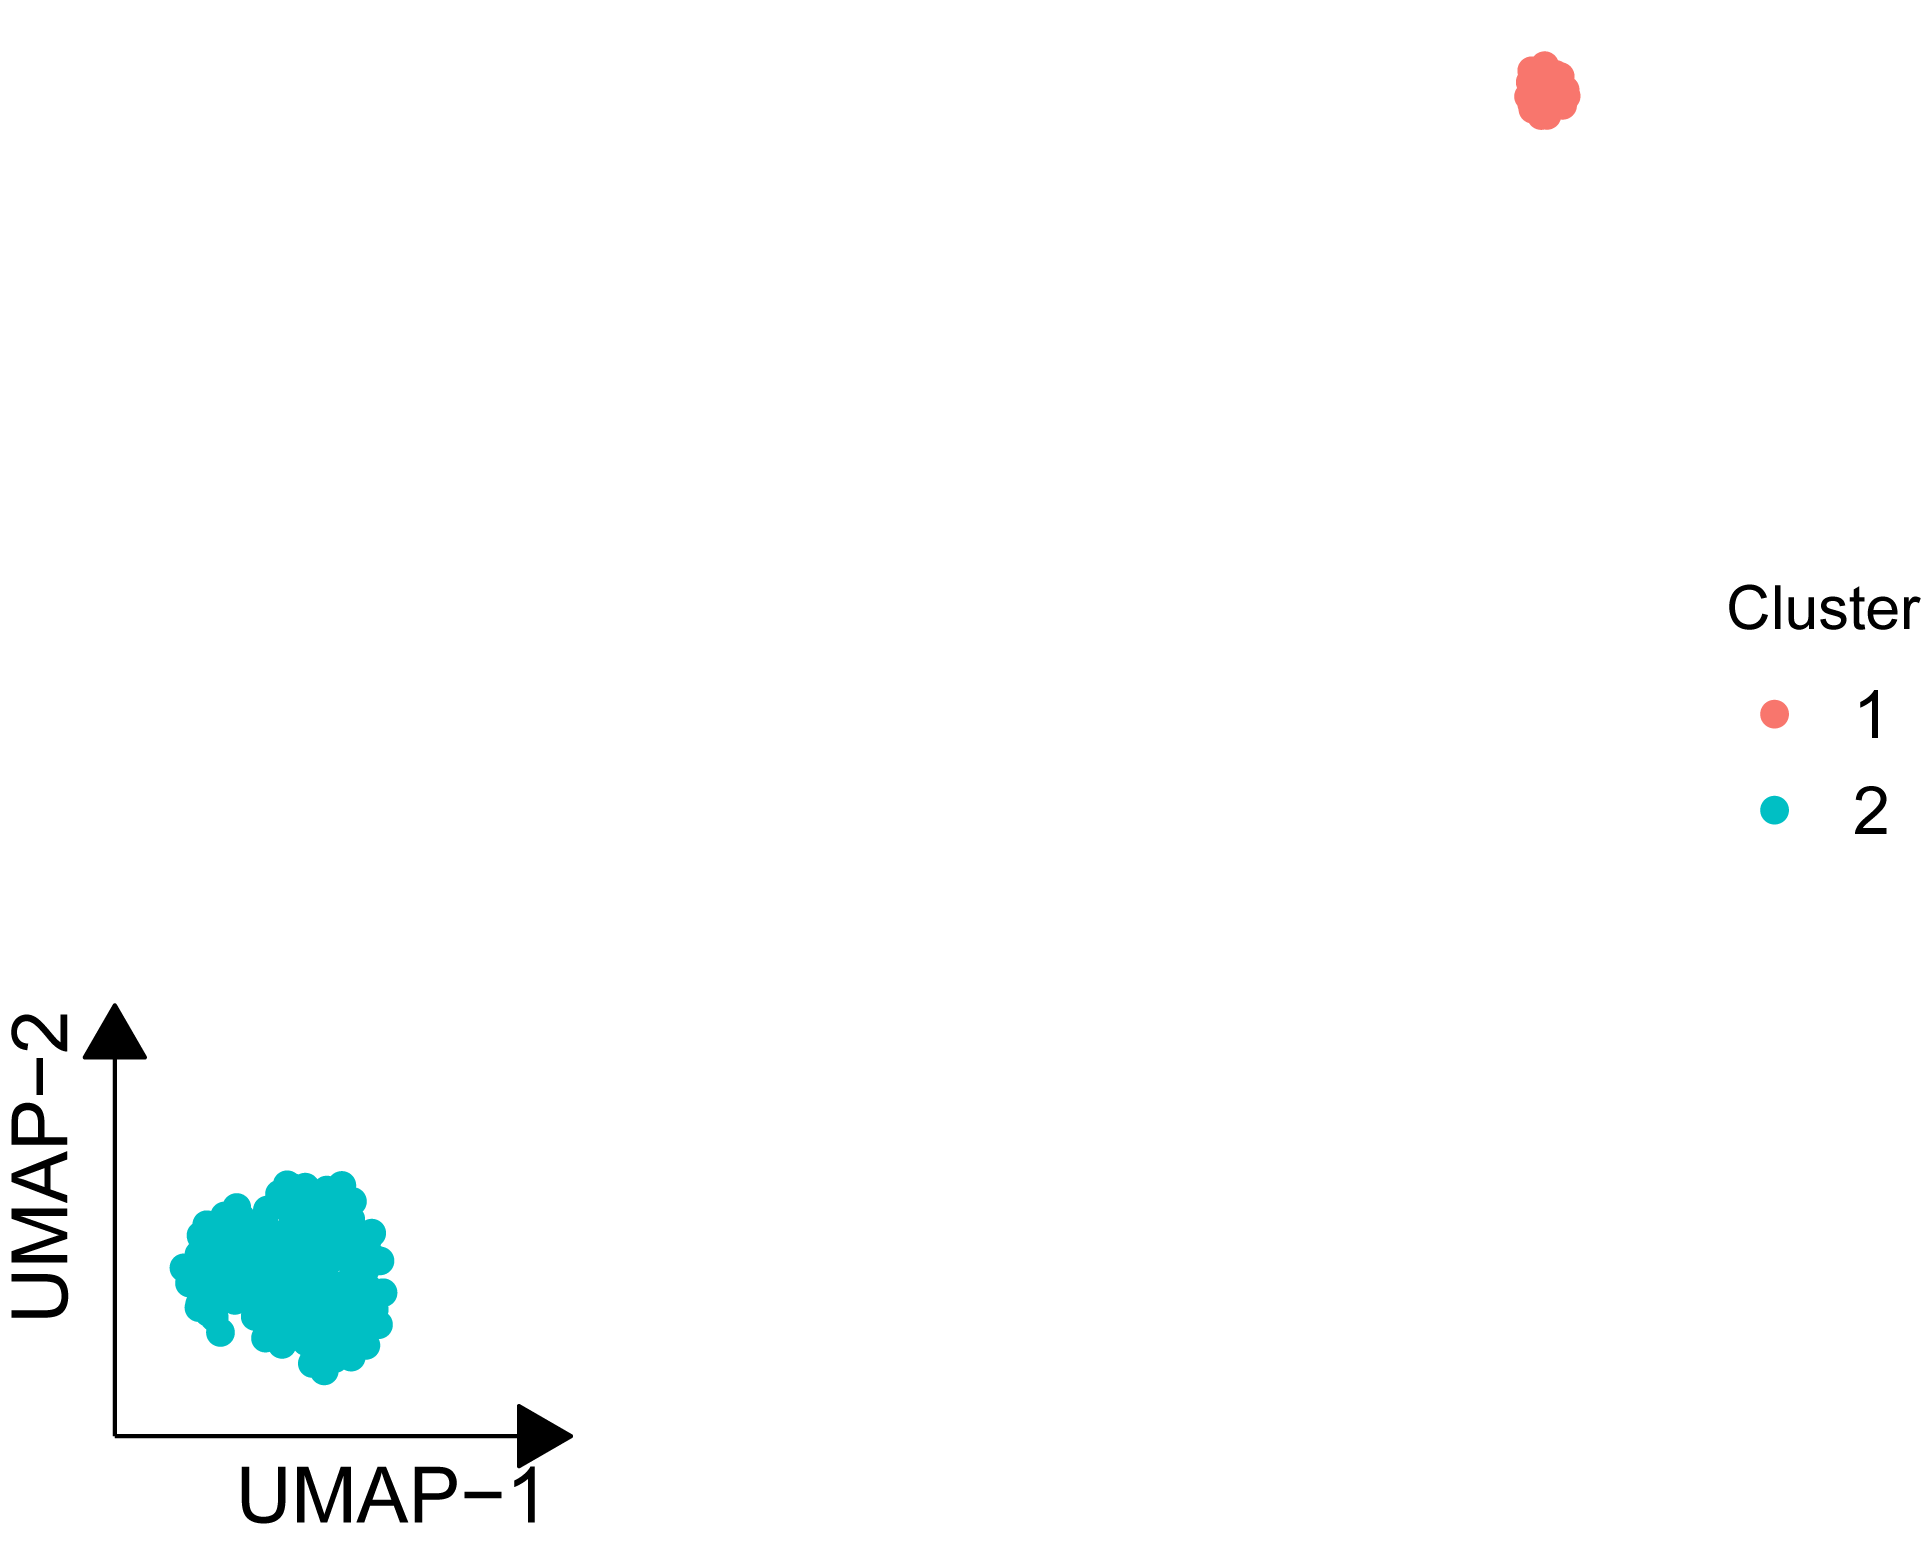
## Visualization
umap.axis <- withr::with_seed(2, uwot::umap(df, n_neighbors = 10, metric = "correlation"))
umap.axis <- as.data.frame(umap.axis); umap.axis$Cluster <- maas.clu$Cluster
colnames(umap.axis) <- c("UMAP-1", "UMAP-2", "Cluster")
ggplot(umap.axis, aes(`UMAP-1`, `UMAP-2`))+
geom_point(aes(color = Cluster), size = 1.75)+
theme_dr()+
labs(x = "UMAP-1", y = "UMAP-2")+
theme(panel.grid = element_blank(),
axis.title = element_text(size = 14),
axis.text = element_blank(),
legend.text = element_text(size = 12))