8.Functional enrichment
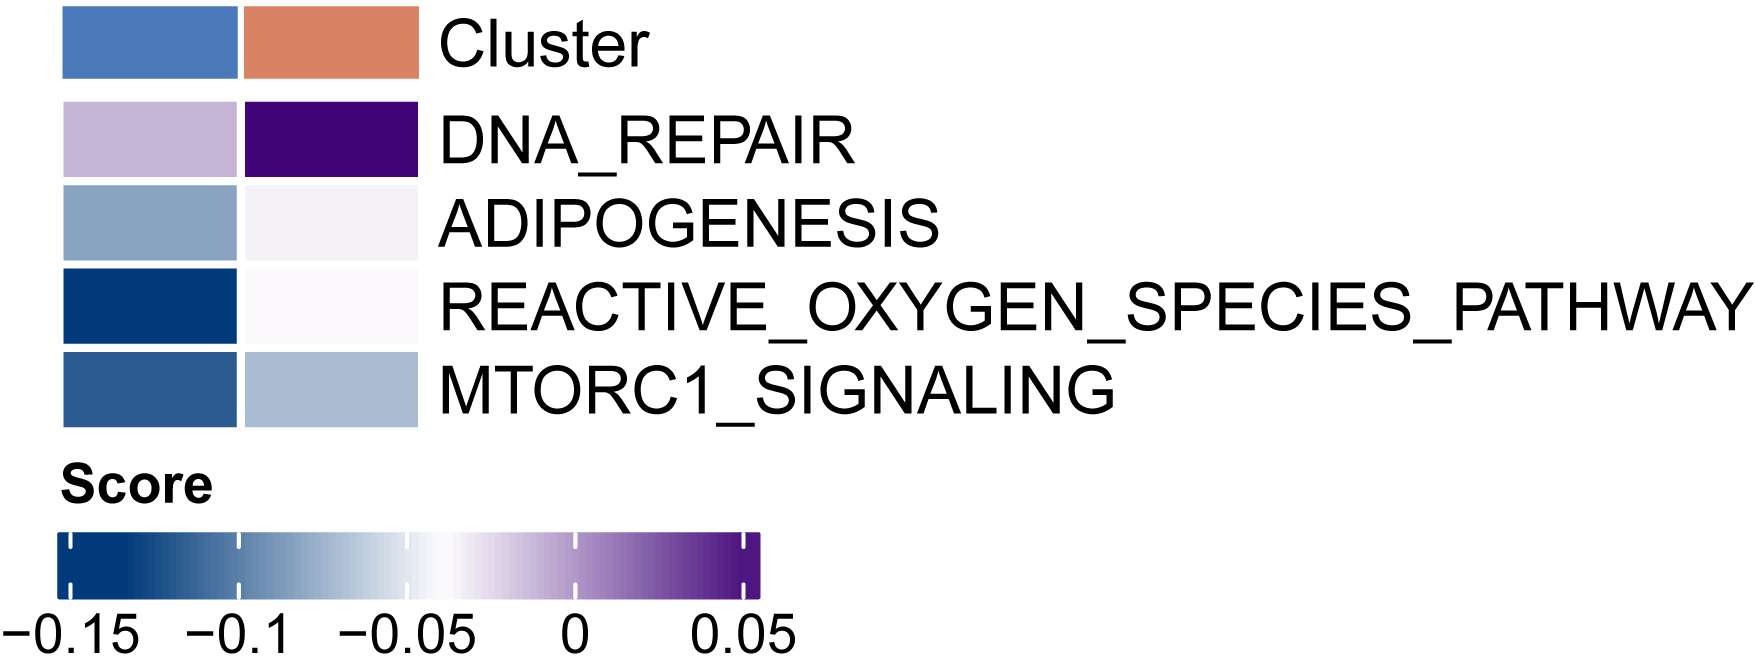
8.Functional_enrichment.RmdWe can finally analyze the biological function enrichment between the subpopulations based on the cancer hallmark signatures, which can be downloaded from MSigDB.
# Clear working space and load libraries
rm(list = ls())
library(GSEABase)
library(GSVA)
library(ComplexHeatmap)
clusterFile <- "../7.Cluster/example.MAAS.clu.rds"
gmtFile <- "h.all.v2023.1.Hs.symbols.gmt"
my_color <- c("#5050FF", "#CE3D32", "#749B58", "#F0E685", "#00BFC4", "#B79F00", "#00BA38")
#读取表达输入文件,并对输入文件整理
combined.pro <- readRDS("../1.Cellanno/scATAC.HCC.pro.annotated.rds")
data <- GetAssayData(combined.pro, slot = "data", assay = "ACTIVITY")
cluster <- readRDS(clusterFile)
cluster$Cluster <- paste0("C", cluster$Cluster)
# data <- data[,rownames(cluster)]
combined.pro <- subset(combined.pro, cells = rownames(cluster))
data <- GetAssayData(combined.pro, slot = "data", assay = "ACTIVITY")
data <- data[apply(data, 1, sd) > 0.2,]

#GSVA分析
geneSets <- getGmt(gmtFile, geneIdType=SymbolIdentifier())
gsvaResult <- GSVA::gsva(as.matrix(data), kcdf = "Gaussian", geneSets, min.sz = 5, verbose = T, parallel.sz = 50)

# #数据合并
gsvaResult <- as.data.frame(t(gsvaResult))
colnames(gsvaResult) <- gsub("HALLMARK_", "", colnames(gsvaResult))
sameSample <- intersect(row.names(gsvaResult), row.names(cluster))
gsvaResult1 <- gsvaResult[sameSample,,drop=F]
cluster <- cluster[sameSample,,drop=F]
gsvaCluster <- cbind(gsvaResult1, Cluster = cluster$Cluster)

# In this case, we perform a very simple t-test to identify dysfunctional hallmarks.
test.res <- data.frame()
for(i in 1:(ncol(gsvaCluster)-1)){

  test.tmp <- t.test(gsvaCluster[gsvaCluster$Cluster == "C1", i],
                          gsvaCluster[gsvaCluster$Cluster == "C2", i])
  test.res <- rbind(test.res, data.frame(Pathway = colnames(gsvaCluster)[i],
                                         Pval = test.tmp$p.value))
}
test.res$Padj <- p.adjust(test.res$Pval, method = "fdr")
test.res <- test.res[test.res$Padj < 0.1,]

hmExp=t(gsvaResult1)[test.res$Pathway,]
hmExp <- as.data.frame(t(hmExp)); hmExp <- hmExp[rownames(cluster),]
hmExp$Cluster <- cluster$Cluster
hmExp <- hmExp %>% group_by(Cluster) %>% dplyr::summarise(across(everything(), mean))
hmExp <- tibble::column_to_rownames(hmExp, var = "Cluster") %>% t()


p <- Heatmap(hmExp,
             top_annotation = HeatmapAnnotation(Cluster = c("C1", "C2"),
                                                gp = gpar(col = "white", lwd = 1.5),
                                                col = list(Cluster = c("C1" = "#4C79BA",
                                                                       "C2" = "#DA8364")),
                                                show_legend = F,
                                                show_annotation_name = T),
             col = colorRampPalette(c("#003A7A", "white", "#410579"))(50),
             heatmap_legend_param = list(legend_direction = "horizontal",
                                         title = "Score"),
             # border = T,
             rect_gp= gpar(col = "white", lwd = 2),
             cluster_rows = T,
             clustering_method_rows = "ward.D",
             cluster_columns = F,
             show_column_names = F,
             show_row_dend = F,
             heatmap_height = unit(0.68, "cm")*nrow(hmExp))
draw(p, heatmap_legend_side="bottom")